Xmaster Formula Indicator [TradingFinder] No Repaint Strategies🔵 Introduction
The Xmaster Formula Indicator is a powerful tool for forex trading, combining multiple technical indicators to provide insights into market trends, support and resistance levels, and price reversals. Developed in the early 2010s, it is widely valued for generating reliable buy and sell signals.
Key components include Exponential Moving Averages (EMA) for identifying trends and price momentum, and MACD (Moving Average Convergence Divergence) for analyzing trend strength and direction.
The Stochastic Oscillator and RSI (Relative Strength Index) enhance accuracy by signaling potential price reversals. Additionally, the Parabolic SAR assists in identifying trend reversals and managing risk.
By integrating these tools, the Xmaster Formula Indicator provides a comprehensive view of market conditions, empowering traders to make informed decisions.
🔵 How to Use
The Xmaster Formula Indicator offers two distinct methods for generating signals: Standard Mode and Advance Mode. Each method caters to different trading styles and strategies.
Standard Mode :
In Standard Mode, the indicator uses normalized moving average data to generate buy and sell signals. The difference between the short-term (10-period) and long-term (38-period) EMAs is calculated and normalized to a 0-100 scale.
Buy Signal : When the normalized value crosses above 55, accompanied by the trend line turning green, a buy signal is generated.
Sell Signal : When the normalized value crosses below 45, and the trend line turns red, a sell signal is issued.
This mode is simple, making it ideal for traders looking for straightforward signals without the need for additional confirmations.
Advance Mode :
Advance Mode combines multiple technical indicators to provide more detailed and robust signals.
This method analyzes trends by incorporating :
🟣 MACD
Buy Signal : When the MACD histogram bars are positive.
Sell Signal : When the MACD histogram bars are negative.
🟣 RSI
Buy Signal : When RSI is below 30, indicating oversold conditions.
Sell Signal : When RSI is above 70, suggesting overbought conditions.
🟣 Stochastic Oscillator
Buy Signal : When Stochastic is below 20.
Sell Signal : When Stochastic is above 80.
🟣 Parabolic SAR
Buy Signal : When SAR is below the price.
Sell Signal : When SAR is above the price.
A signal is generated in Advance Mode only when all these indicators align :
Buy Signal : All conditions point to a bullish trend.
Sell Signal : All conditions indicate a bearish trend.
This mode is more comprehensive and suitable for traders who prefer deeper analysis and stronger confirmations before executing trades.
🔵 Settings
Method :
Choose between "Standard" and "Advance" modes to determine how signals are generated. In Standard Mode, signals are based on normalized moving average data, while in Advance Mode, signals rely on the combination of MACD, RSI, Stochastic Oscillator, and Parabolic SAR.
Moving Average Settings :
Short Length : The period for the short-term EMA (default is 10).
Mid Length : The period for the medium-term EMA (default is 20).
Long Length : The period for the long-term EMA (default is 38).
MACD Settings :
Fast Length : The period for the fast EMA in the MACD calculation (default is 12).
Slow Length : The period for the slow EMA in the MACD calculation (default is 26).
Signal Line : The signal line period for MACD (default is 9).
Stochastic Settings :
Length : The period for the Stochastic Oscillator (default is 14).
RSI Settings :
Length : The period for the Relative Strength Index (default is 14).
🔵 Conclusion
The Xmaster Formula Indicator is a versatile and reliable tool for forex traders, offering both simplicity and advanced analysis through its Standard and Advance modes. In Standard Mode, traders benefit from straightforward signals based on normalized moving average data, making it ideal for quick decision-making.
Advance Mode, on the other hand, provides a more detailed analysis by combining multiple indicators like MACD, RSI, Stochastic Oscillator, and Parabolic SAR, delivering stronger confirmations for critical market decisions.
While the Xmaster Formula Indicator offers valuable insights and reliable signals, it is important to use it alongside proper risk management and other analytical methods. By leveraging its capabilities effectively, traders can enhance their trading strategies and achieve better outcomes in the dynamic forex market.
Cerca negli script per "relative strength"

EMA Crossover with RSI and DistanceEMA Crossover with RSI and Distance Strategy
This strategy combines Exponential Moving Averages (EMA) with Relative Strength Index (RSI) and distance-based conditions to generate buy, sell, and neutral signals. It is designed to help traders identify entry and exit points based on multiple technical indicators.
Key Components:
Exponential Moving Averages (EMA):
The strategy uses four EMAs: EMA 5, EMA 13, EMA 40, and EMA 55.
A buy signal (long) is triggered when EMA 5 crosses above EMA 13 and EMA 40 crosses above EMA 55.
A sell signal (short) is generated when EMA 55 crosses above EMA 40.
The distance between EMAs (5 and 13) is also important. If the current distance between EMA 5 and EMA 13 is smaller than the average distance over the last 5 candles, a neutral condition is triggered, preventing a signal even if all other conditions are met.
Relative Strength Index (RSI):
The 14-period RSI is used to determine market strength and direction.
The strategy requires RSI to be above 50 and greater than the average RSI (over the past 14 periods) for a buy signal.
If the RSI is above 60, a green signal is given, indicating a strong bullish condition, even if the EMA conditions are not fully met.
If the RSI is below 40, a red signal is given, indicating a strong bearish condition, regardless of the EMA crossover.
Distance Conditions:
The strategy calculates the distance between EMA 5 and EMA 13 on each candle and compares it to the average distance of the last 5 candles.
If the current distance between EMA 5 and EMA 13 is lower than the average of the last 5 candles, a neutral signal is triggered. This helps avoid entering a trade when the market is losing momentum.
Additionally, if the distance between EMA 40 and EMA 13 is greater than the previous distance, the previous signal is kept intact, ensuring that the trend is still strong enough for the signal to remain valid.
Signal Persistence:
Once a buy (green) or sell (red) signal is triggered, it remains intact as long as the price is closing above EMA 5 for long trades or below EMA 55 for short trades.
If the price moves below EMA 5 for long trades or above EMA 55 for short trades, the signal is recalculated based on the most recent conditions.
Signal Display:
Green Signals: Represent a strong buy signal and are shown below the candle when the RSI is above 60.
Red Signals: Represent a strong sell signal and are shown above the candle when the RSI is below 40.
Neutral Signals: Displayed when the conditions for entry are not met, specifically when the EMA distance condition is violated.
Long and Short Signals: Additional signals are shown based on the EMA crossovers and RSI conditions. These signals are plotted below the candle for long positions and above the candle for short positions.
Trade Logic:
Long Entry: Enter a long trade when EMA 5 crosses above EMA 13, EMA 40 crosses above EMA 55, and the RSI is above 50 and greater than the average RSI. Additionally, the current distance between EMA 5 and EMA 13 should be larger than the average distance of the last 5 candles.
Short Entry: Enter a short trade when EMA 55 crosses above EMA 40 and the RSI is below 40.
Neutral Condition: If the distance between EMA 5 and EMA 13 is smaller than the average distance over the last 5 candles, the strategy will not trigger a signal, even if other conditions are met.

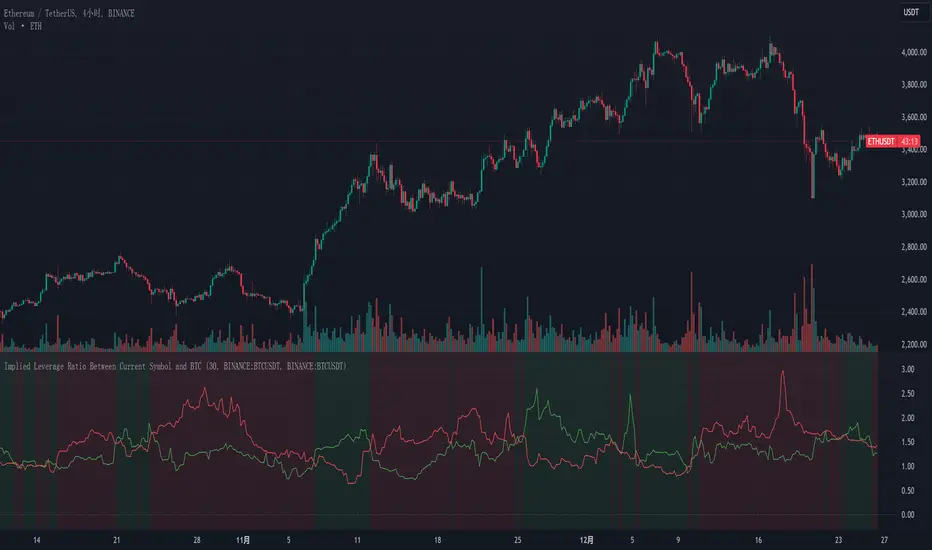
Implied Leverage Ratio Between Current Symbol and BTCThis script calculates and visualizes the implied leverage ratio between the current symbol and Bitcoin (BTC). The implied leverage ratio is computed by comparing the cumulative price changes of the two symbols over a defined number of candles. The results provide insights into how the current symbol performs relative to BTC in terms of bullish (upward) and bearish (downward) movements.
Features
Cumulative Up and Down Ratios:
The script calculates the cumulative price increase (up) and decrease (down) ratios for both the current symbol and BTC. These ratios are based on the percentage changes relative to each candle's opening price.
Implied Leverage Ratio:
For bullish movements, the cumulative up ratio of the current symbol is divided by BTC's cumulative up ratio.
For bearish movements, the cumulative down ratio of the current symbol is divided by BTC's cumulative down ratio.
These values reflect the implied leverage of the current symbol relative to BTC in both directions.
Customizable Comparison Symbol:
By default, the script compares the current symbol to BINANCE:BTCUSDT. However, you can specify any other symbol to tailor the analysis.
Interactive Visualization:
Green Line: Represents the ratio of cumulative up movements (current symbol vs. BTC).
Red Line: Represents the ratio of cumulative down movements (current symbol vs. BTC).
A horizontal zero line is included for reference, ensuring the chart always starts from zero.
How to Use
Add this script to your chart from the Pine Editor or the public library.
Customize the number of candles (t) to define the period over which cumulative changes are calculated.
If desired, replace the comparison symbol with another asset in the input settings.
Analyze the green and red lines to identify relative strength and implied leverage trends.
Who Can Benefit
Traders and Analysts: Gain insights into the relative performance of altcoins, stocks, or other instruments against BTC.
Leverage Seekers: Identify assets with higher or lower implied leverage compared to Bitcoin.
Market Comparisons: Understand how various assets react to market movements relative to BTC.
This tool is particularly useful for identifying potential outperformers or underperformers relative to Bitcoin and can guide strategic decisions in trading pairs or market analysis.
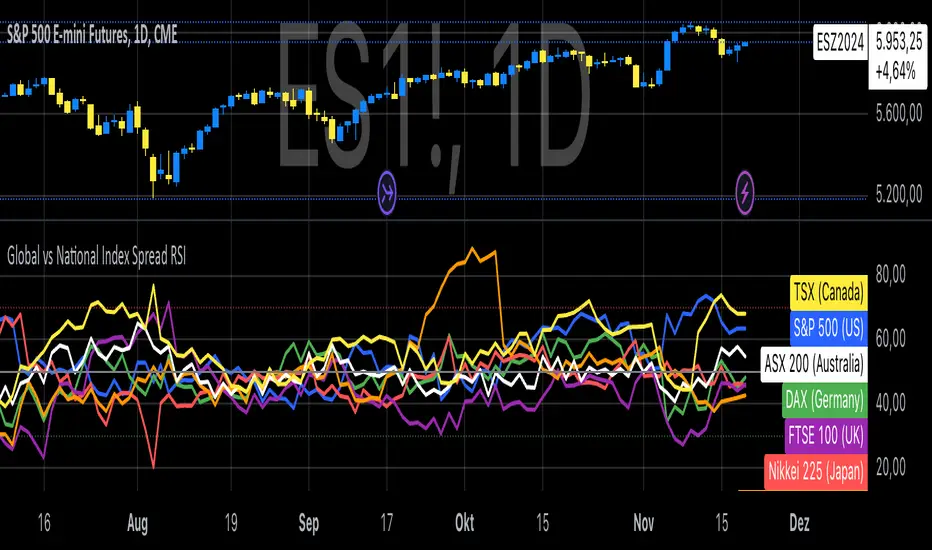
Global vs National Index Spread RSIThe Global vs National Index Spread RSI indicator visualizes the relative strength of national stock indices compared to a global benchmark (e.g., AMEX). It calculates the percentage spread between the closing prices of each national index and the global index, applying the Relative Strength Index (RSI) to each spread.
How It Works
Spread Calculation: The spread represents the percentage difference between a national index and the global index.
RSI Application: RSI is applied to these spreads to identify overbought or oversold conditions in the relative performance of the national indices.
Reference Lines: Overbought (70), oversold (30), and neutral (50) levels help guide interpretation.
Insights from Research
The correlation between global and national indices provides insights into market integration and interdependence. Studies such as Forbes & Rigobon (2002) emphasize the importance of understanding these linkages during periods of financial contagion. Observing spread trends with RSI can aid in identifying shifts in investor sentiment and regional performance anomalies.
Use Cases
- Detect divergences between national and global markets.
- Identify overbought or oversold conditions for specific indices.
- Complement portfolio management strategies by monitoring geographic performance.
References
Forbes, K. J., & Rigobon, R. (2002). "No contagion, only interdependence: Measuring stock market co-movements." Journal of Finance.
Eun, C. S., & Shim, S. (1989). "International transmission of stock market movements." Journal of Financial and Quantitative Analysis.
Wick Trend Analysis with Supertrend and RSI -AYNETScientific Explanation
1. Wick Trend Analysis
Upper and Lower Wicks:
Calculated based on the difference between the high or low price and the candlestick body (open and close).
The trend of these wick lengths is derived using the Simple Moving Average (SMA) over the defined trend_length period.
Trend Direction:
Positive change (ta.change > 0) indicates an increasing trend.
Negative change (ta.change < 0) indicates a decreasing trend.
2. Supertrend Indicator
ATR Bands:
The Supertrend uses the Average True Range (ATR) to calculate dynamic upper and lower bands:
upper_band
=
hl2
+
(
supertrend_atr_multiplier
×
ATR
)
upper_band=hl2+(supertrend_atr_multiplier×ATR)
lower_band
=
hl2
−
(
supertrend_atr_multiplier
×
ATR
)
lower_band=hl2−(supertrend_atr_multiplier×ATR)
Trend Detection:
If the price is above the upper band, the Supertrend moves to the lower band.
If the price is below the lower band, the Supertrend moves to the upper band.
The Supertrend helps identify the prevailing market trend.
3. RSI (Relative Strength Index)
The RSI measures the momentum of price changes and ranges between 0 and 100:
Overbought Zone (Above 70): Indicates that the price may be overextended and due for a pullback.
Oversold Zone (Below 30): Indicates that the price may be undervalued and due for a reversal.
Visualization Features
Wick Trend Lines:
Upper wick trend (green) and lower wick trend (red) show the relative strength of price rejection on both sides.
Wick Trend Area:
The area between the upper and lower wick trends is filled dynamically:
Green: Upper wick trend is stronger.
Red: Lower wick trend is stronger.
Supertrend Line:
Displays the Supertrend as a blue line to highlight the market's directional bias.
RSI:
Plots the RSI line, with horizontal dotted lines marking the overbought (70) and oversold (30) levels.
Applications
Trend Confirmation:
Use the Supertrend and wick trends together to confirm the market's directional bias.
For example, a rising lower wick trend with a bullish Supertrend suggests strong bullish sentiment.
Momentum Analysis:
Combine the RSI with wick trends to assess the strength of price movements.
For example, if the RSI is oversold and the lower wick trend is increasing, it may signal a potential reversal.
Signal Generation:
Generate entry signals when all three indicators align:
Bullish Signal:
Lower wick trend increasing.
Supertrend bullish.
RSI rising from oversold.
Bearish Signal:
Upper wick trend increasing.
Supertrend bearish.
RSI falling from overbought.
Future Improvements
Alert System:
Add alerts for alignment of Supertrend, RSI, and wick trends:
pinescript
Kodu kopyala
alertcondition(upper_trend_direction == 1 and supertrend < close and rsi > 50, title="Bullish Signal", message="Bullish alignment detected.")
alertcondition(lower_trend_direction == 1 and supertrend > close and rsi < 50, title="Bearish Signal", message="Bearish alignment detected.")
Custom Thresholds:
Add thresholds for wick lengths and RSI levels to filter weak signals.
Multiple Timeframes:
Incorporate multi-timeframe analysis for more robust signal generation.
Conclusion
This script combines wick trends, Supertrend, and RSI to create a comprehensive framework for analyzing market sentiment and detecting potential trading opportunities. By visualizing trends, market bias, and momentum, traders can make more informed decisions and reduce reliance on single-indicator strategies.

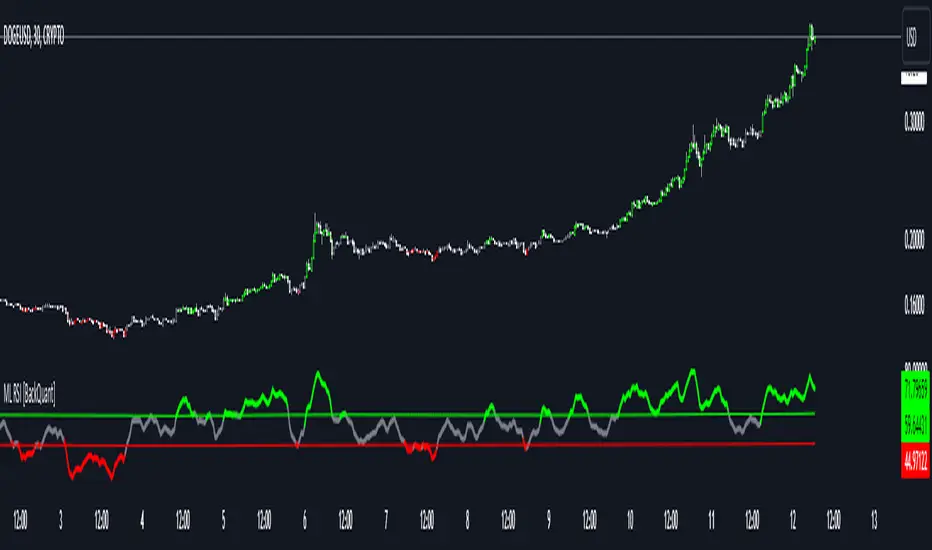
Machine Learning RSI [BackQuant]Machine Learning RSI
The Machine Learning RSI is a cutting-edge trading indicator that combines the power of Relative Strength Index (RSI) with Machine Learning (ML) clustering techniques to dynamically determine overbought and oversold thresholds. This advanced indicator adapts to market conditions in real-time, offering traders a robust tool for identifying optimal entry and exit points with increased precision.
Core Concept: Relative Strength Index (RSI)
The RSI is a well-known momentum oscillator that measures the speed and change of price movements, oscillating between 0 and 100. Typically, RSI values above 70 are considered overbought, and values below 30 are considered oversold. However, static thresholds may not be effective in all market conditions.
This script enhances the RSI by integrating a dynamic thresholding system powered by Machine Learning clustering, allowing it to adapt thresholds based on historical RSI behavior and market context.
Machine Learning Clustering for Dynamic Thresholds
The Machine Learning (ML) component uses clustering to calculate dynamic thresholds for overbought and oversold levels. Instead of relying on fixed RSI levels, this indicator clusters historical RSI values into three groups using a percentile-based initialization and iterative optimization:
Cluster 1: Represents lower RSI values (typically associated with oversold conditions).
Cluster 2: Represents mid-range RSI values.
Cluster 3: Represents higher RSI values (typically associated with overbought conditions).
Dynamic thresholds are determined as follows:
Long Threshold: The upper centroid value of Cluster 3.
Short Threshold: The lower centroid value of Cluster 1.
This approach ensures that the indicator adapts to the current market regime, providing more accurate signals in volatile or trending conditions.
Smoothing Options for RSI
To further enhance the effectiveness of the RSI, this script allows traders to apply various smoothing methods to the RSI calculation, including:
Simple Moving Average (SMA)
Exponential Moving Average (EMA)
Weighted Moving Average (WMA)
Hull Moving Average (HMA)
Linear Regression (LINREG)
Double Exponential Moving Average (DEMA)
Triple Exponential Moving Average (TEMA)
Adaptive Linear Moving Average (ALMA)
T3 Moving Average
Traders can select their preferred smoothing method and adjust the smoothing period to suit their trading style and market conditions. The option to smooth the RSI reduces noise and makes the indicator more reliable for detecting trends and reversals.
Long and Short Signals
The indicator generates long and short signals based on the relationship between the RSI value and the dynamic thresholds:
Long Signals: Triggered when the RSI crosses above the long threshold, signaling bullish momentum.
Short Signals: Triggered when the RSI falls below the short threshold, signaling bearish momentum.
These signals are dynamically adjusted to reflect real-time market conditions, making them more robust than static RSI signals.
Visualization and Clustering Insights
The Machine Learning RSI provides an intuitive and visually rich interface, including:
RSI Line: Plotted in real-time, color-coded based on its position relative to the dynamic thresholds (green for long, red for short, gray for neutral).
Dynamic Threshold Lines: The script plots the long and short thresholds calculated by the ML clustering process, providing a clear visual reference for overbought and oversold levels.
Cluster Plots: Each RSI cluster is displayed with distinct colors (green, orange, and red) to give traders insights into how RSI values are grouped and how the dynamic thresholds are derived.
Customization Options
The Machine Learning RSI is highly customizable, allowing traders to tailor the indicator to their preferences:
RSI Settings : Adjust the RSI length, source price, and smoothing method to match your trading strategy.
Threshold Settings : Define the range and step size for clustering thresholds, allowing you to fine-tune the clustering process.
Optimization Settings : Control the performance memory, maximum clustering steps, and maximum data points for ML calculations to ensure optimal performance.
UI Settings : Customize the appearance of the RSI plot, dynamic thresholds, and cluster plots. Traders can also enable or disable candle coloring based on trend direction.
Alerts and Automation
To assist traders in staying on top of market movements, the script includes alert conditions for key events:
Long Signal: When the RSI crosses above the long threshold.
Short Signal: When the RSI crosses below the short threshold.
These alerts can be configured to notify traders in real-time, enabling timely decisions without constant chart monitoring.
Trading Applications
The Machine Learning RSI is versatile and can be applied to various trading strategies, including:
Trend Following: By dynamically adjusting thresholds, this indicator is effective in identifying and following trends in real-time.
Reversal Trading: The ML clustering process helps identify extreme RSI levels, offering reliable signals for reversals.
Range-Bound Trading: The dynamic thresholds adapt to market conditions, making the indicator suitable for trading in sideways markets where static thresholds often fail.
Final Thoughts
The Machine Learning RSI represents a significant advancement in RSI-based trading indicators. By integrating Machine Learning clustering techniques, this script overcomes the limitations of static thresholds, providing dynamic, adaptive signals that respond to market conditions in real-time. With its robust visualization, customizable settings, and alert capabilities, this indicator is a powerful tool for traders seeking to enhance their momentum analysis and improve decision-making.
As always, thorough backtesting and integration into a broader trading strategy are recommended to maximize the effectiveness!
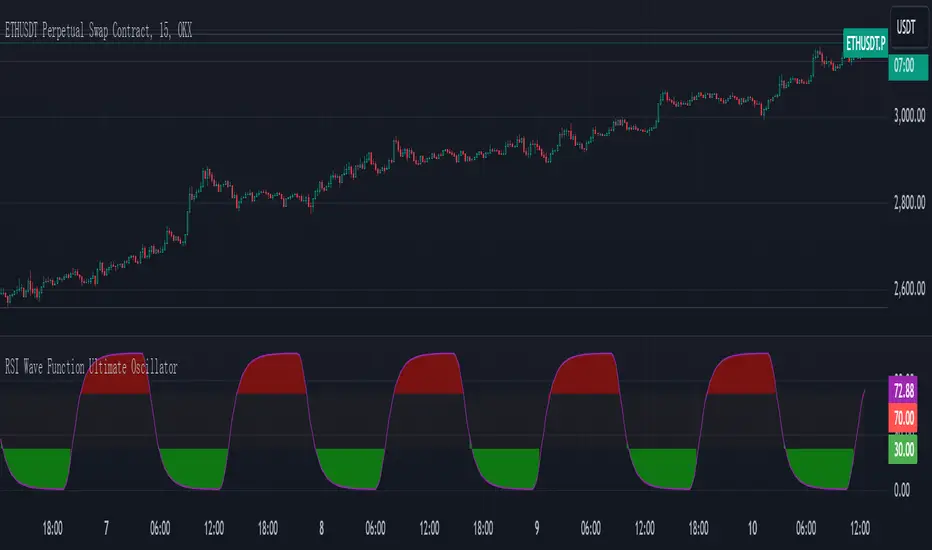
RSI Wave Function Ultimate OscillatorEnglish Explanation of the "RSI Wave Function Ultimate Oscillator" Pine Script Code
Understanding the Code
Purpose:
This Pine Script code creates a custom indicator that combines the Relative Strength Index (RSI) with a wave function to potentially provide more nuanced insights into market dynamics.
Key Components:
* Wave Function: This is a custom calculation that introduces a sinusoidal wave component to the price data. The frequency parameter controls the speed of the oscillation, and the decay factor determines how quickly the influence of past prices diminishes.
* Smoothed Signal: The wave function is applied to the closing price to create a smoothed signal, which is essentially a price series modulated by a sine wave.
* RSI: The traditional RSI is then calculated on this smoothed signal, providing a measure of the speed and change of price movements relative to recent price changes.
Calculation Steps:
* Wave Function Calculation:
* A sinusoidal wave is generated based on the bar index and the frequency parameter.
* The wave is combined with the closing price using a weighted average, where the decay factor determines the weight given to previous values.
* RSI Calculation:
* The RSI is calculated on the smoothed signal using a standard RSI formula.
* Plotting:
* The RSI values are plotted on a chart, along with horizontal lines at 70 and 30 to indicate overbought and oversold conditions.
* The area between the RSI line and the overbought/oversold lines is filled with color to visually represent the market condition.
Interpretation and Usage
* Wave Function: The wave function introduces cyclical patterns into the price data, which can help identify potential turning points or momentum shifts.
* RSI: The RSI provides a measure of the speed and change of price movements relative to recent price changes. When applied to the smoothed signal, it can help identify overbought and oversold conditions, as well as potential divergences between price and momentum.
* Combined Indicator: The combination of the wave function and RSI aims to provide a more sensitive and potentially earlier indication of market reversals.
* Signals:
* Crossovers: Crossovers of the RSI line above or below the overbought/oversold lines can be used to generate buy or sell signals.
* Divergences: Divergences between the price and the RSI can indicate a weakening trend.
* Oscillations: The amplitude and frequency of the oscillations in the RSI can provide insights into the strength and duration of market trends.
How it Reflects Market Volatility
* Amplified Volatility: The wave function can amplify the volatility of the price data, making it easier to identify potential turning points.
* Smoothing: The decay factor helps to smooth out short-term fluctuations, allowing the indicator to focus on longer-term trends.
* Sensitivity: The combination of the wave function and RSI can make the indicator more sensitive to changes in market momentum.
In essence, this custom indicator attempts to enhance traditional RSI analysis by incorporating a cyclical component that can potentially provide earlier signals of market reversals.
Note: The effectiveness of this indicator will depend on various factors, including the specific market, time frame, and the chosen values for the frequency and decay parameters. It is recommended to conduct thorough backtesting and optimize the parameters to suit your specific trading strategy.
Dynamic Market Correlation Analyzer (DMCA) v1.0Description
The Dynamic Market Correlation Analyzer (DMCA) is an advanced TradingView indicator designed to provide real-time correlation analysis between multiple assets. It offers a comprehensive view of market relationships through correlation coefficients, technical indicators, and visual representations.
Key Features
- Multi-asset correlation tracking (up to 5 symbols)
- Dynamic correlation strength categorization
- Integrated technical indicators (RSI, MACD, DX)
- Customizable visualization options
- Real-time price change monitoring
- Flexible timeframe selection
## Use Cases
1. **Portfolio Diversification**
- Identify highly correlated assets to avoid concentration risk
- Find negatively correlated assets for hedging strategies
- Monitor correlation changes during market events
2. Pairs Trading
- Detect correlation breakdowns for potential trading opportunities
- Track correlation strength for pair selection
- Monitor technical indicators for trade timing
3. Risk Management
- Assess portfolio correlation risk in real-time
- Monitor correlation shifts during market stress
- Identify potential portfolio vulnerabilities
4. **Market Analysis**
- Study sector relationships and rotations
- Analyze cross-asset correlations (e.g., stocks vs. commodities)
- Track market regime changes through correlation patterns
Components
Input Parameters
- **Timeframe**: Custom timeframe selection for analysis
- **Length**: Correlation calculation period (default: 20)
- **Source**: Price data source selection
- **Symbol Selection**: Up to 5 customizable symbols
- **Display Options**: Table position, text color, and size settings
Technical Indicators
1. **Correlation Coefficient**
- Range: -1 to +1
- Strength categories: Strong/Moderate/Weak (Positive/Negative)
2. **RSI (Relative Strength Index)**
- 14-period default setting
- Momentum comparison across assets
3. **MACD (Moving Average Convergence Divergence)**
- Standard settings (12, 26, 9)
- Trend direction indicator
4. **DX (Directional Index)**
- Trend strength measurement
- Based on DMI calculations
Visual Components
1. **Correlation Table**
- Symbol identifiers
- Correlation coefficients
- Correlation strength descriptions
- Price change percentages
- Technical indicator values
2. **Correlation Plot**
- Real-time correlation visualization
- Multiple correlation lines
- Reference levels at -1, 0, and +1
- Color-coded for easy identification
Installation and Setup
1. Load the indicator on TradingView
2. Configure desired symbols (up to 5)
3. Adjust timeframe and calculation length
4. Customize display settings
5. Enable/disable desired components (table, plot, RSI)
Best Practices
1. **Symbol Selection**
- Choose related but distinct assets
- Include a mix of asset classes
- Consider market cap and liquidity
2. **Timeframe Selection**
- Match timeframe to trading strategy
- Consider longer timeframes for strategic analysis
- Use shorter timeframes for tactical decisions
3. **Interpretation**
- Monitor correlation changes over time
- Consider multiple timeframes
- Combine with other technical analysis tools
- Account for market conditions and volatility
Performance Notes
- Calculations update in real-time
- Resource usage scales with number of active symbols
- Historical data availability may affect initial calculations
Version History
- v1.0: Initial release with core functionality
- Multi-symbol correlation analysis
- Technical indicator integration
- Customizable display options
Future Enhancements (Planned)
- Additional technical indicators
- Advanced correlation algorithms
- Enhanced visualization options
- Custom alert conditions
- Statistical significance testing

Supertrend StrategyThe Supertrend Strategy was created based on the Supertrend and Relative Strength Index (RSI) indicators, widely respected tools in technical analysis. This strategy combines these two indicators to capture market trends with precision and reliability, looking for optimizing exit levels at oversold or overbought price levels.
The Supertrend indicator identifies trend direction based on price and volatility by using the Average True Range (ATR). The ATR measures market volatility by calculating the average range between an asset’s high and low prices over a set period. It provides insight into price fluctuations, with higher ATR values indicating increased volatility and lower values suggesting stability. The Supertrend Indicator plots a line above or below the price, signaling potential buy or sell opportunities: when the price closes above the Supertrend line, an uptrend is indicated, while a close below the line suggests a downtrend. This line shifts as price movements and volatility levels change, acting as both a trailing stop loss and trend confirmation.
To enhance the Supertrend strategy, the Relative Strength Index (RSI) has been added as an exit criterion. As a momentum oscillator, the RSI indicates overbought (usually above 70) or oversold (usually below 30) conditions. This integration allows trades to close when the asset is overbought or oversold, capturing gains before a possible reversal, even if the percentage take profit level has not been reached. This mechanism aims to prevent losses due to market reversals before the Supertrend signal changes.
### Key Features
1. **Entry criteria**:
- The strategy uses the Supertrend indicator calculated by adding or subtracting a multiple of the ATR from the closing price, depending on the trend direction.
- When the price crosses above the Supertrend line, the strategy signals a long (buy) entry. Conversely, when the price crosses below, it signals a short (sell) entry.
- The strategy performs a reversal if there is an open position and a change in the direction of the supertrend occurs
2. **Exit criteria**:
- Take profit of 30% (default) on the average position price.
- Oversold (≤ 5) or overbought (≥ 95) RSI
- Reversal when there is a change in direction of the Supertrend
3. **No Repainting**:
- This strategy is not subject to repainting, as long as the timeframe configured on your chart is the same as the supertrend timeframe .
4. **Position Sizing by Equity and risk management**:
- This strategy has a default configuration to operate with 35% of the equity. At the time of opening the position, the supertrend line is typically positioned at about 12 to 16% of the entry price. This way, the strategy is putting at risk about 16% of 35% of equity, that is, around 5.6% of equity for each trade. The percentage of equity can be adjusted by the user according to their risk management.
5. **Backtest results**:
- This strategy was subjected to deep backtesting and operations in replay mode, including transaction fees of 0.12%, and slippage of 5 ticks.
- The past results in deep backtest and replay mode were compatible and profitable (Variable results depending on the take profit used, supertrend and RSI parameters). However, it should be noted that few operations were evaluated, since the currency in question has been created for a short time and the frequency of operations is relatively small.
- Past results are no guarantee of future results. The strategy's backtest results may even be due to overfitting with past data.
Default Settings
Chart timeframe: 2h
Supertrend Factor: 3.42
ATR period: 14
Supertrend timeframe: 2 h
RSI timeframe: 15 min
RSI Lenght: 5 min
RSI Upper limit: 95
RSI Lower Limit: 5
Take Profit: 30%
BYBIT:1000000MOGUSDT.P

RSI with Dynamic ColorsThe "RSI with Dynamic Colors" is a custom indicator built on top of the traditional Relative Strength Index (RSI), which helps traders identify overbought or oversold market conditions. This enhanced version includes added functionality like dynamic colors, highlighting specific conditions, and more customization options. Here's a breakdown of how this indicator works:
Indicator Components:
Relative Strength Index (RSI) Calculation:
The RSI is a momentum oscillator that measures the speed and change of price movements. It oscillates between 0 and 100, helping traders determine if an asset is overbought or oversold.
In this version, the RSI is calculated with a configurable lookback period (default is 14) and applies smoothing to both upward and downward price changes using the Relative Moving Average (RMA).
Dynamic Coloring:
The indicator dynamically changes the color of the RSI line based on its value. Specific thresholds include:
Blue: When the RSI is at or above an extreme overbought level (≥ 85).
Red: When the RSI is in the overbought zone (≥ 70 but < 85).
Yellow: When the RSI is at or below the extreme oversold level (≤ 15).
Green: When the RSI is in the oversold zone (≤ 30 but > 15).
White: When the RSI is between the oversold and overbought zones.
Moving Average Options (MA):
The indicator allows the user to plot an optional moving average of the RSI for additional trend confirmation. Users can select from various types of moving averages, including Simple Moving Average (SMA), Exponential Moving Average (EMA), and others.
Bollinger Bands can be optionally applied around the RSI to visualize volatility.
Overbought and Oversold Highlights:
It provides visual highlights (green for overbought and red for oversold) in the background of the RSI plot, making it easier to identify potential reversal zones.
Divergence Detection (Optional):
The indicator can optionally display regular bullish or bearish divergence, which can signal potential trend reversals. Divergence occurs when price moves in the opposite direction of the RSI.
Bullish divergence is indicated when the price makes lower lows while the RSI makes higher lows.
Bearish divergence is shown when the price makes higher highs while the RSI makes lower highs.
Alerts:
Users can set up alerts for bullish or bearish divergence, making it easier to get notified when key conditions occur in the market.
Use Case:
This custom RSI indicator is designed for traders who want to combine the classic RSI functionality with enhanced visual aids, such as color coding for different RSI zones, customizable moving averages, and Bollinger Bands. It is particularly useful for identifying potential market tops and bottoms by highlighting overbought/oversold conditions and divergence signals.
In summary, this indicator not only retains the traditional RSI's power but also adds new layers of insight through color, moving averages, and divergence detection, helping traders make better-informed decisions.

Signals Pro [traderslog]The "Signals Pro" indicator is an advanced and versatile trading tool designed to help traders accurately identify key buy and sell signals using a combination of technical analysis factors such as candle patterns , RSI (Relative Strength Index) , and candle stability . It is highly customizable and offers a range of options that make it suitable for both short-term and long-term traders. By filtering market noise and providing actionable insights, this indicator enhances decision-making and helps traders capitalize on market movements.
At the core of the "Signals Pro" indicator is the concept of Candle Stability . The Candle Stability Index measures the ratio between a candle's body and its wicks, providing insight into the strength of the price movement during that period. A higher value indicates that the candle is more stable, meaning that the price has moved significantly without much retracement. This stability filter is crucial because it prevents the generation of signals during volatile or choppy market conditions where price direction is uncertain. Traders can adjust the Candle Stability Index from 0 to 1, allowing for precise control over how stable a candle must be for the indicator to generate a signal.
Another key feature is the use of RSI (Relative Strength Index) , a momentum oscillator that measures the speed and change of price movements. The RSI index parameter in the indicator can be customized to detect overbought or oversold conditions. When the RSI falls below the defined threshold, it signals that the market may be oversold , which can indicate a potential buying opportunity . Conversely, when the RSI exceeds a certain value, it suggests that the market is overbought , signaling a potential selling opportunity . This allows traders to time their trades more effectively by entering when market conditions are favorable and exiting before a potential reversal occurs.
The Candle Delta Length is another critical element of the "Signals Pro" indicator. This parameter measures how much the price has increased or decreased over a specific number of candles. By adjusting the Candle Delta Length , traders can define how many periods the indicator should analyze before generating a signal. A longer Candle Delta Length means the price has been trending in one direction for a longer period, providing more reliable signals. For instance, if the price has been steadily decreasing for five candles, this could signal a bullish reversal , triggering a buy signal .
To further enhance its accuracy, the "Signals Pro" indicator includes a unique feature that allows traders to disable repeating signals . This is particularly useful in situations where the market is moving sideways or during low volatility periods, where multiple signals may cluster close together, creating confusion. By enabling the disable repeating signals option, traders can prevent these repeated signals and focus on the most important and confirmed signals, ensuring cleaner charts and reducing the risk of overtrading.
A key technical aspect of the indicator is its ability to detect bullish and bearish engulfing patterns . The indicator looks for bullish engulfing patterns, which occur when a bullish candle fully engulfs the body of the previous bearish candle, signaling a potential bullish reversal . Conversely, bearish engulfing patterns occur when a bearish candle fully engulfs the previous bullish candle, indicating a bearish reversal . By incorporating these candle patterns with the Candle Stability Index and RSI levels , the indicator provides highly reliable signals based on price action and market sentiment.
Visual customization is another major advantage of the "Signals Pro" indicator. Traders can choose from several different label styles , such as text bubbles , triangles , or arrows to mark the buy and sell signals on the chart. This makes the signals stand out and easy to interpret at a glance. Furthermore, the color of these signals can be customized: green for buy signals and red for sell signals , along with options to adjust the text size and label styles for even more personalization. Traders can make the signals more or less prominent based on their preference, enhancing readability and workflow efficiency.
The indicator also includes a comprehensive alert system , ensuring traders never miss an opportunity. Alerts can be set for both buy and sell signals , and the system triggers in real-time when a valid signal is generated. This is especially useful for active traders who want to stay on top of the markets without constantly monitoring their screens. The alert system helps ensure that traders are notified of potential trading opportunities as soon as they arise, allowing them to act quickly in volatile markets.
From a practical standpoint, the "Signals Pro" indicator is designed to work seamlessly across multiple timeframes, making it suitable for scalpers, day traders, swing traders, and even long-term investors. Its flexibility allows it to adapt to different trading styles and time horizons, providing value for a wide range of market participants.
In summary, the Signals Pro indicator offers a robust and customizable solution for identifying buy and sell signals . By combining candle stability , RSI analysis , and engulfing patterns , the indicator provides traders with reliable signals to enter or exit trades. The ability to customize signal appearance, coupled with a real-time alert system , makes the "Signals Pro" indicator an invaluable tool for traders looking to improve their timing and decision-making. Whether you are looking to capture short-term price movements or want to time entries and exits in longer-term trends, this indicator offers the insights needed to navigate the markets with confidence.

Multi-Assets Monthly/Weekly/Daily/ Rate Multi-Assets Rate Indicator
This indicator provides a comprehensive view of performance across multiple asset classes, including Forex pairs, Indices, Commodities, and Cryptocurrencies. It offers the following features:
1. Asset Type Selection: Users can choose between "FOREX" and "Other Assets" to view different sets of instruments.
2. Timeframe Flexibility: Performance can be analyzed on Weekly, Daily, or Monthly timeframes.
3. Performance Metrics:
- Current Period Performance: Percentage change in the selected timeframe.
- Previous Period Performance: Percentage change in the previous period.
- Rate of Change: Difference between current and previous period performances.
4. Visual Representation: Results are displayed in a color-coded table for easy interpretation.
- Green indicates positive performance
- Red indicates negative performance
5. Customizable Symbols: Users can input their preferred symbols for each category.
6. Categorized View: When "Other Assets" is selected, the table is organized into Indices, Commodities, and Cryptocurrencies for better clarity.
This indicator is designed to help traders and investors quickly assess and compare performance across various financial instruments and asset classes. It's particularly useful for identifying trends, comparing relative strengths, and making informed decisions based on multi-timeframe analysis.
Note: This indicator relies on data provided by TradingView. Ensure that you have access to the required data feeds for accurate results.
Disclaimer: This indicator is for informational purposes only and should not be considered as financial advice. Always conduct your own research and consider your financial situation before making investment decisions.

Simple RSI stock Strategy [1D] The "Simple RSI Stock Strategy " is designed to long-term traders. Strategy uses a daily time frame to capitalize on signals generated by the Relative Strength Index (RSI) and the Simple Moving Average (SMA). This strategy is suitable for low-leverage trading environments and focuses on identifying potential buy opportunities when the market is oversold, while incorporating strong risk management with both dynamic and static Stop Loss mechanisms.
This strategy is recommended for use with a relatively small amount of capital and is best applied by diversifying across multiple stocks in a strong uptrend, particularly in the S&P 500 stock market. It is specifically designed for equities, and may not perform well in other markets such as commodities, forex, or cryptocurrencies, where different market dynamics and volatility patterns apply.
Indicators Used in the Strategy:
1. RSI (Relative Strength Index):
- The RSI is a momentum oscillator used to identify overbought and oversold conditions in the market.
- This strategy enters long positions when the RSI drops below the oversold level (default: 30), indicating a potential buying opportunity.
- It focuses on oversold conditions but uses a filter (SMA 200) to ensure trades are only made in the context of an overall uptrend.
2. SMA 200 (Simple Moving Average):
- The 200-period SMA serves as a trend filter, ensuring that trades are only executed when the price is above the SMA, signaling a bullish market.
- This filter helps to avoid entering trades in a downtrend, thereby reducing the risk of holding positions in a declining market.
3. ATR (Average True Range):
- The ATR is used to measure market volatility and is instrumental in setting the Stop Loss.
- By multiplying the ATR value by a custom multiplier (default: 1.5), the strategy dynamically adjusts the Stop Loss level based on market volatility, allowing for flexibility in risk management.
How the Strategy Works:
Entry Signals:
The strategy opens long positions when RSI indicates that the market is oversold (below 30), and the price is above the 200-period SMA. This ensures that the strategy buys into potential market bottoms within the context of a long-term uptrend.
Take Profit Levels:
The strategy defines three distinct Take Profit (TP) levels:
TP 1: A 5% from the entry price.
TP 2: A 10% from the entry price.
TP 3: A 15% from the entry price.
As each TP level is reached, the strategy closes portions of the position to secure profits: 33% of the position is closed at TP 1, 66% at TP 2, and 100% at TP 3.
Visualizing Target Points:
The strategy provides visual feedback by plotting plotshapes at each Take Profit level (TP 1, TP 2, TP 3). This allows traders to easily see the target profit levels on the chart, making it easier to monitor and manage positions as they approach key profit-taking areas.
Stop Loss Mechanism:
The strategy uses a dual Stop Loss system to effectively manage risk:
ATR Trailing Stop: This dynamic Stop Loss adjusts based on the ATR value and trails the price as the position moves in the trader’s favor. If a price reversal occurs and the market begins to trend downward, the trailing stop closes the position, locking in gains or minimizing losses.
Basic Stop Loss: Additionally, a fixed Stop Loss is set at 25%, limiting potential losses. This basic Stop Loss serves as a safeguard, automatically closing the position if the price drops 25% from the entry point. This higher Stop Loss is designed specifically for low-leverage trading, allowing more room for market fluctuations without prematurely closing positions.
to determine the level of stop loss and target point I used a piece of code by RafaelZioni, here is the script from which a piece of code was taken
Together, these mechanisms ensure that the strategy dynamically manages risk while offering robust protection against significant losses in case of sharp market downturns.
The position size has been estimated by me at 75% of the total capital. For optimal capital allocation, a recommended value based on the Kelly Criterion, which is calculated to be 59.13% of the total capital per trade, can also be considered.
Enjoy !

Balance of Power [SYNC & TRADE]Balance of Power
Overview
This indicator analyzes the balance of power between buyers and sellers in the market. It uses volume, price action and the relative strength index (RSI) to determine the strength of buyers and sellers, as well as to identify potential zones where one side dominates the other.
How it works
The indicator calculates the average volume over a specified period.
It determines the strength of each bar, taking into account volume and price action.
RSI is used as an additional factor to assess the strength of the trend.
Based on these factors, the "balance of power" between buyers and sellers is calculated.
When the balance of power exceeds a specified threshold, the indicator marks the beginning of the "buyer zone" or "seller zone".
How to use
Add the indicator to your chart in TradingView.
Configure the input parameters:
"Period for average volume": determines the sensitivity to volume changes.
"RSI period": affects the sensitivity of the RSI to price changes.
"Strength threshold": sets the level for determining a significant imbalance.
"Table Size": select the appropriate size of the information table.
Observe the signals on the chart:
Blue triangle up: the beginning of the buyer zone.
Red triangle down: the beginning of the seller zone.
Use the information table to get additional data:
Current balance of power
Buyers or sellers have strength
Current RSI value
Advantages
Comprehensive analysis of market conditions
Visual signals for potential entry points
Customizable parameters to adapt to different trading styles
Informative table for quick analysis of the current situation
Limitations
Like any indicator, it can give false signals
Requires additional analysis and confirmation with other tools
Efficiency may vary depending on market conditions
Recommendations
Use this indicator in combination with other analysis methods to make trading decisions. Experiment with the settings to optimize for your trading style and selected assets.
Balance of Power Ru
Обзор
Этот индикатор анализирует баланс сил между покупателями и продавцами на рынке. Он использует объем, ценовое движение и индекс относительной силы (RSI) для определения силы покупателей и продавцов, а также для выявления потенциальных зон, где одна сторона доминирует над другой.
Как это работает
Индикатор рассчитывает среднее значение объема за указанный период.
Он определяет силу каждого бара, учитывая объем и ценовое движение.
RSI используется как дополнительный фактор для оценки силы тренда.
На основе этих факторов вычисляется "баланс сил" между покупателями и продавцами.
Когда баланс сил превышает заданный порог, индикатор отмечает начало "зоны покупателей" или "зоны продавцов".
Как использовать
Добавьте индикатор на ваш график в TradingView.
Настройте входные параметры:
"Период для среднего объема": определяет чувствительность к изменениям объема.
"Период RSI": влияет на чувствительность RSI к ценовым изменениям.
"Порог силы": устанавливает уровень для определения значимого дисбаланса.
"Размер таблицы": выберите подходящий размер информационной таблицы.
Наблюдайте за сигналами на графике:
Синий треугольник вверх: начало зоны покупателей.
Красный треугольник вниз: начало зоны продавцов.
Используйте информационную таблицу для получения дополнительных данных:
Текущий баланс сил
Наличие силы у покупателей или продавцов
Текущее значение RSI
Преимущества
Комплексный анализ рыночных условий
Визуальные сигналы для потенциальных точек входа
Настраиваемые параметры для адаптации к разным торговым стилям
Информативная таблица для быстрого анализа текущей ситуации
Ограничения
Как и любой индикатор, может давать ложные сигналы
Требует дополнительного анализа и подтверждения другими инструментами
Эффективность может варьироваться в зависимости от рыночных условий
Рекомендации
Используйте этот индикатор в сочетании с другими методами анализа для принятия торговых решений. Экспериментируйте с настройками для оптимизации под ваш торговый стиль и выбранные активы.

Multi-Sector Trend AnalysisThis script, titled "Multi-Sector Trend Analysis: Track Sector Momentum and Trends," is designed to assist traders and investors in monitoring multiple sectors of the stock market simultaneously. It leverages technical analysis by incorporating trend detection and momentum indicators like moving averages and the Relative Strength Index (RSI) to offer insights into the price action of various market sectors.
Core Features:
1. Sector-Based Analysis: The script covers 20 major sectors from the NSE (National Stock Exchange) such as Auto, Banking, Energy, FMCG, IT, Pharma, and others. Users can customize which sectors they wish to analyze using the available input fields.
Technical Indicators: The script uses two core technical indicators to detect trends and momentum:
2. Moving Averages: The script calculates both fast and slow exponential moving averages (EMAs). These are critical for identifying short- and long-term price trends and crossovers, helping detect shifts in momentum.
3. Relative Strength Index (RSI): A well-known momentum indicator that shows whether a stock is overbought or oversold. This script uses a 14-period RSI to gauge the strength of each sector.
4. Trend Detection: The script identifies whether the current market trend is "Up" or "Down" based on the relationship between the fast and slow EMAs (i.e., whether the fast EMA is above or below the slow EMA). It highlights this trend visually in a table format, allowing quick and easy trend recognition.
5. Gain/Loss Tracking: This feature calculates the percentage gain or loss since the last EMA crossover (a key point in trend change), giving users a sense of how much the price has moved since the trend shifted.
6. Customizable Table for Display: The script displays the analyzed data in a table format, where users can view each sector's:
Symbol
Trend (Up or Down)
RSI Value
Gain/Loss Since the Last EMA Crossover
This table is customizable in terms of size and color theme (dark or light), providing flexibility in presentation for different charting styles.
How It Works:
Sector Selection: Users can input up to 20 different sector symbols for analysis.
Moving Averages: Users can define the period lengths for both the fast and slow EMAs to suit their trading strategies.
Table Options: Choose between different table sizes and opt for a dark theme to enhance the visual appearance on charts.
How to Use:
Select the symbols (sectors) that you want to track. The script includes pre-configured symbols for major sectors on the NSE, but you can modify these to suit your needs.
Adjust the fast and slow EMA lengths to your preference. A common setting would be 3 for the fast EMA and 4 for the slow EMA, but more conservative traders might opt for higher values.
Customize the table size and theme based on your preference, whether you want a compact table or a larger one for easier readability.
Why Use This Script:
This script is ideal for traders looking to:
Monitor multiple market sectors simultaneously.
Identify key trends across sectors quickly.
Understand momentum and detect potential reversals through RSI and EMA crossovers.
Stay informed on sector performance using a clear visual table that tracks gains or losses.
By using this script, traders can gain better insights into sector-based trading strategies, improve their sector rotation tactics, and stay informed about the broader market environment. It provides a powerful yet easy-to-use tool for both beginner and advanced traders.

Relative volume zone + Smart Order Flow Dynamic S/ROverview:
The Relative Volume Zone + Smart Order Flow with Dynamic S/R indicator is designed to help traders identify key trading opportunities by combining multiple technical components. This script integrates relative volume analysis, order flow detection, VWAP, RSI filtering, and dynamic support and resistance levels to offer a comprehensive view of the market conditions. It is particularly effective on shorter timeframes (M5, M15), making it suitable for scalping and day trading strategies.
Key Components:
1. Relative Volume Zones:
• The script calculates the relative volume by comparing the current volume with the average volume over a defined lookback period (volLookback). When the relative volume exceeds a specified multiplier (volMultiplier), it indicates a high volume zone, signaling potential accumulation or distribution areas.
• Purpose: Identifies high-volume trading zones that may act as significant support or resistance, indicating possible entry or exit points.
2. Smart Order Flow Analysis:
• The indicator uses Volume Delta (the difference between buying and selling volume) and a Cumulative Delta to detect order imbalances in the market.
• Order Imbalance is identified using a moving average of the Volume Delta (orderImbalance), which helps highlight hidden buying or selling pressure.
• Purpose: Reveals market sentiment by showing whether buyers or sellers dominate the market, aiding in the identification of trend reversals or continuations.
3. VWAP (Volume Weighted Average Price):
• VWAP is calculated over a default daily length (vwapLength) to show the average price a security has traded at throughout the day, based on both volume and price.
• Purpose: Provides insight into the fair value of the asset, indicating whether the market is in an accumulation or distribution phase.
4. RSI (Relative Strength Index) Filter:
• RSI is used to filter buy and sell signals, preventing trades in overbought or oversold conditions. It is calculated using a specified period (rsiPeriod).
• Purpose: Reduces false signals and improves trade accuracy by only allowing trades when RSI conditions align with volume and order flow signals.
5. Dynamic Support and Resistance Levels:
• The script dynamically plots support and resistance levels based on recent swing highs and lows (swingLookback).
• Purpose: Identifies potential reversal zones where price action may change direction, allowing for more precise entry and exit points.
How It Works:
• Buy Signal:
A buy signal is generated when:
• The price enters a high-volume zone.
• The price crosses above a 5-period moving average.
• The cumulative delta shows more buying pressure (cumulativeDelta > SMA of cumulativeDelta).
• The RSI is below 70 (not in overbought conditions).
• Sell Signal:
A sell signal is generated when:
• The price enters a high-volume zone.
• The price crosses below a 5-period moving average.
• The cumulative delta shows more selling pressure (cumulativeDelta < SMA of cumulativeDelta).
• The RSI is above 30 (not in oversold conditions).
• Dynamic Support and Resistance Lines:
Drawn based on recent swing highs and lows, these lines provide context for potential price reversals or breakouts.
• VWAP and Order Imbalance Lines:
Plotted to show the average traded price and highlight order flow shifts, helping to validate buy/sell signals.
How to Use:
1. Apply the Indicator:
Add the script to your chart and adjust the settings to match your trading style and preferred timeframe (optimized for M5/M15).
2. Interpret the Signals:
Use the buy and sell signals in conjunction with dynamic support/resistance, VWAP, and order imbalance lines to identify high-probability trade setups.
3. Monitor Alerts:
Set alerts for significant order flow events to receive notifications when there is a positive or negative order imbalance, indicating potential market shifts.
What Makes It Unique:
This script is unique because it combines multiple market analysis tools — relative volume zones, smart order flow, VWAP, RSI filtering, and dynamic support/resistance — to provide a well-rounded, multi-dimensional view of the market. This integration allows traders to make more informed decisions by validating signals across various indicators, enhancing overall trading accuracy and effectiveness.

Bollinger Bands with RSI Buy/Sell Signals (15 min) Bollinger Bands with RSI Buy/Sell Signals (15 Min)
Description:
The Bollinger Bands with RSI Buy/Sell Signals (15 Min) indicator is designed to help traders identify potential reversal points in the market using two popular technical indicators: Bollinger Bands and the Relative Strength Index (RSI).
How It Works:
Bollinger Bands:
Bollinger Bands consist of an upper band, lower band, and a middle line (Simple Moving Average). These bands adapt to market volatility, expanding during high volatility and contracting during low volatility.
This indicator monitors the 15-minute Bollinger Bands. If the price moves completely outside the bands, it signals that the market is potentially overextended.
Relative Strength Index (RSI):
RSI is a momentum indicator that measures the strength of price movements. RSI readings above 70 indicate an overbought condition, while readings below 30 suggest an oversold condition.
This indicator uses the RSI on the 15-minute time frame to further confirm overbought and oversold conditions.
Buy/Sell Signal Generation:
Buy Signal:
A buy signal is triggered when the market price crosses above the lower Bollinger Band on the 15-minute time frame, indicating that the market may be oversold.
Additionally, the RSI must be below 30, confirming an oversold condition.
A "Buy" label appears below the price when this condition is met.
Sell Signal:
A sell signal is triggered when the market price crosses below the upper Bollinger Band on the 15-minute time frame, indicating that the market may be overbought.
The RSI must be above 70, confirming an overbought condition.
A "Sell" label appears above the price when this condition is met.

Larry Connors %b Strategy (Bollinger Band)Larry Connors’ %b Strategy is a mean-reversion trading approach that uses Bollinger Bands to identify buy and sell signals based on the %b indicator. This strategy was developed by Larry Connors, a renowned trader and author known for his systematic, data-driven trading methods, particularly those focusing on short-term mean reversion.
The %b indicator measures the position of the current price relative to the Bollinger Bands, which are volatility bands placed above and below a moving average. The strategy specifically targets times when prices are oversold within a long-term uptrend and aims to capture rebounds by buying at relatively low points and selling at relatively high points.
Strategy Rules
The basic rules of the %b Strategy are:
1. Trend Confirmation: The closing price must be above the 200-day moving average. This filter ensures that trades are made in alignment with a longer-term uptrend, thereby avoiding trades against the primary market trend.
2. Oversold Conditions: The %b indicator must be below 0.2 for three consecutive days. The %b value below 0.2 indicates that the price is near the lower Bollinger Band, suggesting an oversold condition.
3. Entry Signal: Enter a long position at the close when conditions 1 and 2 are met.
4. Exit Signal: Exit the position when the %b value closes above 0.8, signaling an overbought condition where the price is near the upper Bollinger Band.
How the Strategy Works
This strategy operates on the premise of mean reversion, which suggests that extreme price movements will revert to the mean over time. By entering positions when the %b value indicates an oversold condition (below 0.2) in a confirmed uptrend, the strategy attempts to capture short-term price rebounds. The exit rule (when %b is above 0.8) aims to lock in profits once the price reaches an overbought condition, often near the upper Bollinger Band.
Who Was Larry Connors?
Larry Connors is a well-known figure in the world of financial markets and trading. He co-authored several influential trading books, including “Short-Term Trading Strategies That Work” and “High Probability ETF Trading.” Connors is recognized for his quantitative approach, focusing on systematic, rules-based strategies that leverage historical data to validate trading edges.
His work primarily revolves around short-term trading strategies, often using technical indicators like RSI (Relative Strength Index), Bollinger Bands, and moving averages. Connors’ methodologies have been widely adopted by traders seeking structured approaches to exploit short-term inefficiencies in the market.
Risks of the Strategy
While the %b Strategy can be effective, particularly in mean-reverting markets, it is not without risks:
1. Mean Reversion Assumption: The strategy is based on the assumption that prices will revert to the mean. In trending or sharply falling markets, this reversion may not occur, leading to sustained losses.
2. False Signals in Choppy Markets: In volatile or sideways markets, the strategy may generate multiple false signals, resulting in whipsaw trades that can erode capital through frequent small losses.
3. No Stop Loss: The basic implementation of the strategy does not include a stop loss, which increases the risk of holding losing trades longer than intended, especially if the market continues to move against the position.
4. Performance During Market Crashes: During major market downturns, the strategy’s buy signals could be triggered frequently as prices decline, compounding losses without the presence of a risk management mechanism.
Scientific References and Theoretical Basis
The %b Strategy relies on the concept of mean reversion, which has been extensively studied in finance literature. Studies by Avellaneda and Lee (2010) and Bouchaud et al. (2018) have demonstrated that mean-reverting strategies can be profitable in specific market environments, particularly when combined with volatility filters like Bollinger Bands. However, the same studies caution that such strategies are highly sensitive to market conditions and often perform poorly during periods of prolonged trends.
Bollinger Bands themselves were popularized by John Bollinger and are widely used to assess price volatility and detect potential overbought and oversold conditions. The %b value is a critical part of this analysis, as it standardizes the position of price relative to the bands, making it easier to compare conditions across different securities and time frames.
Conclusion
Larry Connors’ %b Strategy is a well-known mean-reversion technique that leverages Bollinger Bands to identify buying opportunities in uptrending markets when prices are temporarily oversold. While the strategy can be effective under the right conditions, traders should be aware of its limitations and risks, particularly in trending or highly volatile markets. Incorporating risk management techniques, such as stop losses, could help mitigate some of these risks, making the strategy more robust against adverse market conditions.

Enhanced Alligator Trend Indicator By Er. Parvez HaleemPurpose: The Enhanced Alligator Trend Indicator aims to identify strong and reliable buy and sell signals on the price chart by combining the Alligator Indicator with trend strength and volume filters. It is specifically designed for use on a 1-minute chart to enhance precision in short-term trading decisions.
Components:
Alligator Indicator:
Jaw Line (Blue): Calculated as a simple moving average (SMA) of the closing price over a specified period (default: 13 bars). Represents the long-term trend.
Teeth Line (Red): Calculated as a simple moving average (SMA) of the closing price over a shorter period (default: 8 bars). Represents the medium-term trend.
Lips Line (Green): Calculated as a simple moving average (SMA) of the closing price over an even shorter period (default: 5 bars). Represents the short-term trend.
Trend Strength Indicator:
Relative Strength Index (RSI): Measures the strength of the current trend, using a default period of 14 bars. RSI values above 50 suggest a bullish trend, while values below 50 suggest a bearish trend.
Volume Filter:
Volume Threshold: Filters signals based on trading volume to ensure they only appear when volume exceeds a specified threshold (default: 100,000). This helps to avoid low-volume noise and enhance signal reliability.
Additional Trend Filters:
Short-Term SMA: A simple moving average with a default period of 20 bars, used to assess short-term trend direction.
Long-Term SMA: A simple moving average with a default period of 50 bars, used to assess long-term trend direction.
SMA Crossover: A bullish crossover occurs when the short-term SMA is above the long-term SMA, and a bearish crossover occurs when the short-term SMA is below the long-term SMA.
Signal Generation:
Buy Signal: Generated when:
The Lips line is above the Teeth line, and the Teeth line is above the Jaw line (indicating a bullish alignment in the Alligator Indicator).
The RSI is above 50 (indicating strong bullish trend strength).
The trading volume exceeds the specified volume threshold (indicating sufficient trading activity).
The short-term SMA is above the long-term SMA (confirming a bullish trend).
Sell Signal: Generated when:
The Lips line is below the Teeth line, and the Teeth line is below the Jaw line (indicating a bearish alignment in the Alligator Indicator).
The RSI is below 50 (indicating strong bearish trend strength).
The trading volume exceeds the specified volume threshold (indicating sufficient trading activity).
The short-term SMA is below the long-term SMA (confirming a bearish trend).
Plotting on Chart:
Alligator Lines: The Jaw, Teeth, and Lips lines are plotted directly on the price chart in blue, red, and green, respectively, to indicate the long-term, medium-term, and short-term trends.
Buy/Sell Signals: Buy signals are plotted below the price bars in green, and sell signals are plotted above the price bars in red. These signals are marked with labels ("BUY" and "SELL") to clearly indicate trading opportunities.
Debugging: RSI and SMA lines are plotted but hidden by default. They can be revealed for verification purposes to ensure the correctness of the indicator’s calculations.
Alerts:
Buy Alert: Triggers when a buy signal condition is met, sending a notification that a buy opportunity has been identified.
Sell Alert: Triggers when a sell signal condition is met, sending a notification that a sell opportunity has been identified.

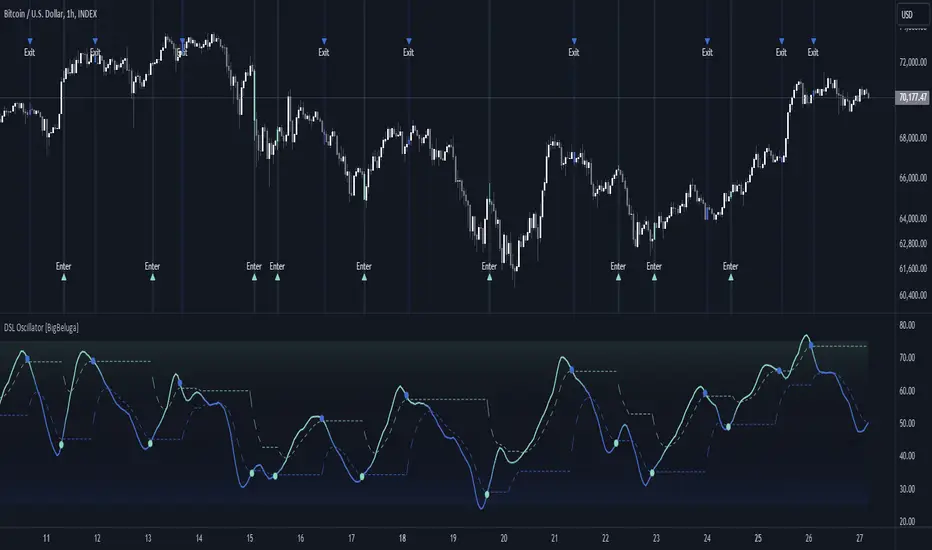
DSL Oscillator [BigBeluga]DSL Oscillator BigBeluga
The DSL (Discontinued Signal Lines) Oscillator is an advanced technical analysis tool that combines elements of the Relative Strength Index (RSI), Discontinued Signal Lines, and Zero-Lag Exponential Moving Average (ZLEMA). This versatile indicator is designed to help traders identify trend direction, momentum, and potential reversal points in the market.
What are Discontinued Signal Lines (DSL)?
Discontinued Signal Lines are an extension of the traditional signal line concept used in many indicators. While a standard signal line compares an indicator's value to its smoothed (slightly lagging) state, DSL takes this idea further by using multiple adaptive lines that respond to the indicator's current value. This approach provides a more nuanced view of the indicator's state and momentum, making it easier to determine trends and desired states of the indicator.
🔵 KEY FEATURES
● Discontinued Signal Lines (DSL)
Uses multiple adaptive lines that respond to the indicator's value
Provides a more nuanced view of the indicator's state and momentum
Helps determine trends and desired states of the indicator more effectively
Available in "Fast" and "Slow" modes for different responsiveness
Acts as dynamic support and resistance levels for the oscillator
● DSL Oscillator
Based on a combination of RSI and Discontinued Signal Lines
// Discontinued Signal Lines
dsl_lines(src, length)=>
UP = 0.
DN = 0.
UP := (src > ta.sma(src, length)) ? nz(UP ) + dsl_mode / length * (src - nz(UP )) : nz(UP )
DN := (src < ta.sma(src, length)) ? nz(DN ) + dsl_mode / length * (src - nz(DN )) : nz(DN )
Smoothed using Zero-Lag Exponential Moving Average for reduced lag
// Zero-Lag Exponential Moving Average function
zlema(src, length) =>
lag = math.floor((length - 1) / 2)
ema_data = 2 * src - src
ema2 = ta.ema(ema_data, length)
ema2
Oscillates between 0 and 100
Color-coded for easy interpretation of market conditions
● Signal Generation
Generates buy signals when the oscillator crosses above the lower DSL line below 50
Generates sell signals when the oscillator crosses below the upper DSL line above 50
Signals are visualized on both the oscillator and the main chart
● Visual Cues
Background color changes on signal occurrences for easy identification
Candles on the main chart are colored based on the latest signal
Oscillator line color changes based on its position relative to the DSL lines
🔵 HOW TO USE
● Trend Identification
Use the color and position of the DSL Oscillator relative to its Discontinued Signal Lines to determine the overall market trend
● Entry Signals
Look for buy signals (green circles) when the oscillator crosses above the lower DSL line
Look for sell signals (blue circles) when the oscillator crosses below the upper DSL line
Confirm signals with the triangles on the main chart and background color changes
● Exit Signals
Consider exiting long positions on exit signals and short positions on Entery signals
Watch for the oscillator crossing back between the DSL lines as a potential early exit signal
● Momentum Analysis
Strong momentum is indicated when the oscillator moves rapidly towards extremes and away from the DSL lines
Weakening momentum can be spotted when the oscillator struggles to reach new highs or lows, or starts converging with the DSL lines
The space between the DSL lines can indicate potential momentum strength - wider gaps suggest stronger trends
● Confirmation
Use the DSL lines as dynamic support/resistance levels for the oscillator
Look for convergence between oscillator signals and price action on the main chart
Combine signals with other technical indicators or chart patterns for stronger confirmation
🔵 CUSTOMIZATION
The DSL Oscillator offers several customization options:
Adjust the main calculation length for the DSL lines
Choose between "Fast" and "Slow" modes for the DSL lines calculation
By fine-tuning these settings, traders can adapt the DSL Oscillator to various market conditions and personal trading strategies.
The DSL Oscillator provides a multi-faceted approach to market analysis, combining trend identification, momentum assessment, and signal generation in one comprehensive tool. Its dynamic nature and visual cues make it suitable for both novice and experienced traders across various timeframes and markets. The integration of RSI, Discontinued Signal Lines, and ZLEMA offers traders a sophisticated yet intuitive tool to inform their trading decisions.
The use of Discontinued Signal Lines sets this oscillator apart from traditional indicators by providing a more adaptive and nuanced view of market conditions. This can potentially lead to more accurate trend identification and signal generation, especially in markets with varying volatility.
Traders can use the DSL Oscillator to identify trends, spot potential reversals, and gauge market momentum. The combination of the oscillator, dynamic signal lines, and clear visual signals provides a holistic view of market conditions. As with all technical indicators, it's recommended to use the DSL Oscillator in conjunction with other forms of analysis and within the context of a well-defined trading strategy.
RSI K-Means Clustering [UAlgo]The "RSI K-Means Clustering " indicator is a technical analysis tool that combines the Relative Strength Index (RSI) with K-means clustering techniques. This approach aims to provide more nuanced insights into market conditions by categorizing RSI values into overbought, neutral, and oversold clusters.
The indicator adjusts these clusters dynamically based on historical RSI data, allowing for more adaptive and responsive thresholds compared to traditional fixed levels. By leveraging K-means clustering, the indicator identifies patterns in RSI behavior, which can help traders make more informed decisions regarding market trends and potential reversals.
🔶 Key Features
K-means Clustering: The indicator employs K-means clustering, an unsupervised machine learning technique, to dynamically determine overbought, neutral, and oversold levels based on historical RSI data.
User-Defined Inputs: You can customize various aspects of the indicator's behavior, including:
RSI Source: Select the data source used for RSI calculation (e.g., closing price).
RSI Length: Define the period length for RSI calculation.
Training Data Size: Specify the number of historical RSI values used for K-means clustering.
Number of K-means Iterations: Set the number of iterations performed by the K-means algorithm to refine cluster centers.
Overbought/Neutral/Oversold Levels: You can define initial values for these levels, which will be further optimized through K-means clustering.
Alerts: The indicator can generate alerts for various events, including:
Trend Crossovers: Alerts for when the RSI crosses above/below the neutral zone, signaling potential trend changes.
Overbought/Oversold: Alerts when the RSI reaches the dynamically determined overbought or oversold thresholds.
Reversals: Alerts for potential trend reversals based on RSI crossing above/below the calculated overbought/oversold levels.
RSI Classification: Alerts based on the current RSI classification (ranging, uptrend, downtrend).
🔶 Interpreting Indicator
Adjusted RSI Value: The primary plot represents the adjusted RSI value, calculated based on the relative position of the current RSI compared to dynamically adjusted overbought and oversold levels. This value provides an intuitive measure of the market's momentum. The final overbought, neutral, and oversold levels are determined by K-means clustering and are displayed as horizontal lines. These levels serve as dynamic support and resistance points, indicating potential reversal zones.
Classification Symbols : The "RSI K-Means Clustering " indicator uses specific symbols to classify the current market condition based on the position of the RSI value relative to dynamically determined clusters. These symbols provide a quick visual reference to help traders understand the prevailing market sentiment. Here's a detailed explanation of each classification symbol:
Ranging Classification ("R")
This symbol appears when the RSI value is closest to the neutral threshold compared to the overbought or oversold thresholds. It indicates a ranging market, where the price is moving sideways without a clear trend direction. In this state, neither buyers nor sellers are in control, suggesting a period of consolidation or indecision. This is often seen as a time to wait for a breakout or reversal signal before taking a position.
Up-Trend Classification ("↑")
The up-trend symbol, represented by an upward arrow, is displayed when the RSI value is closer to the overbought threshold than to the neutral or oversold thresholds. This classification suggests that the market is in a bullish phase, with buying pressure outweighing selling pressure. Traders may consider this as a signal to enter or hold long positions, as the price is likely to continue rising until the market reaches an overbought condition.
Down-Trend Classification ("↓")
The down-trend symbol, depicted by a downward arrow, appears when the RSI value is nearest to the oversold threshold. This indicates a bearish market condition, where selling pressure dominates. The market is likely experiencing a downward movement, and traders might view this as an opportunity to enter or hold short positions. This symbol serves as a warning of potential further declines, especially if the RSI continues to move toward the oversold level.
Bullish Reversal ("▲")
This signal occurs when the RSI value crosses above the oversold threshold. It indicates a potential shift from a downtrend to an uptrend, suggesting that the market may start to move higher. Traders might use this signal as an opportunity to enter long positions.
Bearish Reversal ("▼")
This signal appears when the RSI value crosses below the overbought threshold. It suggests a possible transition from an uptrend to a downtrend, indicating that the market may begin to decline. This signal can alert traders to consider entering short positions or taking profits on long positions.
These classification symbols are plotted near the adjusted RSI line, with their positions adjusted based on the standard deviation and a distance multiplier. This placement helps in visualizing the classification's strength and ensuring clarity in the indicator's presentation. By monitoring these symbols, traders can quickly assess the market's state and make more informed trading decisions.
🔶 Disclaimer
Use with Caution: This indicator is provided for educational and informational purposes only and should not be considered as financial advice. Users should exercise caution and perform their own analysis before making trading decisions based on the indicator's signals.
Not Financial Advice: The information provided by this indicator does not constitute financial advice, and the creator (UAlgo) shall not be held responsible for any trading losses incurred as a result of using this indicator.
Backtesting Recommended: Traders are encouraged to backtest the indicator thoroughly on historical data before using it in live trading to assess its performance and suitability for their trading strategies.
Risk Management: Trading involves inherent risks, and users should implement proper risk management strategies, including but not limited to stop-loss orders and position sizing, to mitigate potential losses.
No Guarantees: The accuracy and reliability of the indicator's signals cannot be guaranteed, as they are based on historical price data and past performance may not be indicative of future results.

Uptrick: Bullish/Bearish Signal DetectorDetailed Explanation of the "Uptrick: Bullish/Bearish Signal Detector" Script
The "Uptrick: Bullish/Bearish Signal Detector" script is a sophisticated tool designed for the TradingView platform, leveraging Pine Script version 5. This script is crafted to enhance traders' ability to identify bullish (buy) and bearish (sell) signals directly on their trading charts. By combining the power of the MACD (Moving Average Convergence Divergence) and RSI (Relative Strength Index) indicators, this script provides a unique and efficient method for detecting potential trading opportunities. Below is an in-depth exploration of its purpose, features, and functionality.
Purpose
The primary purpose of this script is to assist traders in identifying potential entry and exit points in the market by signaling bullish and bearish conditions. This automated detection helps traders make more informed decisions without the need to manually analyze complex indicators. By overlaying signals directly on the price chart, the script allows for quick visual identification of market trends and reversals.
Uniqueness
What sets this script apart is its dual use of MACD and RSI indicators. While many trading strategies might rely on a single indicator, combining MACD and RSI enhances the reliability of the signals by filtering out false positives. The script not only identifies trends but also adds a layer of confirmation through the RSI, which measures the speed and change of price movements.
Inputs and Features
Customizable Label Appearance:
The script allows users to customize the appearance of the labels that indicate bullish and bearish signals. Users can set their preferred colors for the labels and the text, ensuring that the signals are easily distinguishable and aesthetically pleasing on their charts.
MACD Calculation:
The script calculates the MACD line and signal line using user-defined input values for the fast length, slow length, and signal length. The MACD histogram, which is the difference between the MACD line and the signal line, is used to determine the momentum of the market.
RSI Calculation:
The RSI is calculated using a user-defined input length. The RSI helps in identifying overbought or oversold conditions, which are crucial for confirming the strength of the trend detected by the MACD.
Bullish and Bearish Conditions:
The script defines bullish conditions as those where the MACD histogram is positive and the RSI is above 50. Bearish conditions are defined where the MACD histogram is negative and the RSI is below 50. This combination of conditions ensures that signals are generated based on both momentum and relative strength, reducing the likelihood of false signals.
Label Plotting:
The script plots labels on the chart to indicate bullish and bearish signals. When a bullish condition is met, and the previous signal was not bullish, a "LONG" label is plotted. Similarly, when a bearish condition is met, and the previous signal was not bearish, a "SHORT" label is plotted. This feature helps in clearly marking the points of interest for traders, making it easier to spot potential trades.
Tracking Previous Signals:
To avoid repetitive signals, the script keeps track of the last signal. If the last signal was bullish, it avoids plotting another bullish signal immediately. The same logic applies to bearish signals. This tracking ensures that signals are spaced out and only significant changes in market conditions are highlighted.
How It Works
The script operates in a loop, processing each bar (or candlestick) on the chart as new data comes in. It calculates the MACD and RSI values for each bar and checks if the current conditions meet the criteria for a bullish or bearish signal. If a signal is detected and it is different from the last signal, a label is plotted on the chart at the current bar's price level. This real-time processing allows traders to see the signals as they form, providing timely insights into market movements.
Practical Application
For practical use, a trader would add this script to their TradingView chart. They can customize the input parameters for the MACD and RSI calculations to fit their trading strategy or preferred settings. Once added, the script will automatically analyze the price data and start plotting "LONG" and "SHORT" labels based on the detected signals. Traders can then use these labels to make decisions on entering or exiting trades, adjusting their strategy as necessary based on the signals provided.
Conclusion
The "Uptrick: Bullish/Bearish Signal Detector" script is a powerful tool for any trader looking to leverage technical indicators for better trading decisions. By combining MACD and RSI, it offers a robust method for detecting market trends and potential reversals. The customizable features and real-time signal plotting make it a versatile and user-friendly addition to any trading toolkit. This script not only simplifies the process of technical analysis but also enhances the accuracy of trading signals, thereby potentially increasing the trader's success rate in the market.

Ratio Chart with GMMA■About this indicator
This indicator divides the selected stocks by any stocks you specify and plots the result in a new pane.
At the same time, it plots the GMMA against the result of the division.
This allows you to see the relative chart and trend of the selected stock and the arbitrary stock.
Quote Symbol: Specify the denominator of the division. The default is TOPIX. Feel free to change it.
EMA Days: 5 to 30 days are indicated in green, and 75 to 200 days in red. Change the number of days and color freely.
Explanation of Effective Usage
It is recommended to enter an index for stocks specified in the Quote Symbol.
By entering the index, you can check the superiority of the selected issue and the index at a glance.
Example: By dividing AAPL by SP500, you can see on the chart whether AAPL is stronger or weaker relative to SP500.
(Similar concept to the Relative Strength Comparison RSC.)
At the same time, by plotting GMMA, you can confirm the trend of strength or weakness of the selected issue divided by the index. This is useful for swing trading and mid- to long-term trading.
The greater the distance between the short-term and long-term EMAs of the GMMA, the more the selected stocks outperform the index, and when the short-term and long-term EMAs cross, the trend ends and the stock underperforms the index.
■About the Chart
The screen below shows a chart plotted using this indicator.
For comparison with the regular chart, the upper screen shows only the GMMA plotted for the selected stocks.
From the red circle in the lower screen, a trend begins where the selected stocks outperform the index, and the trend ends at the blue circle.
When the trend ends, the selected stocks will underperform the index and it can be determined that it is more efficient to invest in another stock.
■このインジケーターについて
このインジケーターは選択している銘柄を、指定した任意の銘柄で割り算し、その結果を新規ペインにプロットします。
同時に、割り算の結果に対してGMMAをプロットします。
これにより選択した銘柄と、任意の銘柄の相対チャートとトレンドを把握することが出来ます。
Quote Symbol:割り算の分母を指定します。デフォルトはTOPIXです。自由に変更して下さい。
EMA日数:5~30日が緑、75~200日を赤で表記しています。日数と色は自由に変更して下さい。
■有効な使い方の説明
Quote Symbolで指定する銘柄は、指数を入力することを推奨します。
指数を入力することによって、選択した銘柄と指数の優位性を一目で確認出来ます。
例)AAPLをSP500で割ることで、SP500に比べてAAPLが相対的に強いのか、弱いのかをチャートで把握できます。
(相対力比較RSCと似たような考え方です。)
同時にGMMAをプロットすることで、選択した銘柄÷指数の強弱のトレンドを確認できます。これはスイングトレードや中長期トレードに役立ちます。
GMMAの短期EMAと長期EMAの距離が開いていくほど、指数より選択した銘柄がアウトパフォームしていると考えられ、短期EMAと長期EMAが交わるとトレンドは終了し、指数をアンダーパフォームします。
■チャートについて
下の画面がこのインジケーターを使用してプロットしたチャートです。
通常のチャートとの比較のため、上画面には選択した銘柄にGMMAだけをプロットしたものを表示しています。
下の画面の赤い丸から、選択した銘柄が指数をアウトパフォームするトレンドが始まり、青い〇でトレンドは終了します。
トレンドが終了した場合、選択した銘柄は指数をアンダーパフォームするので、別の銘柄に投資する方が効率的と判断できます。
